Questions
Short answer
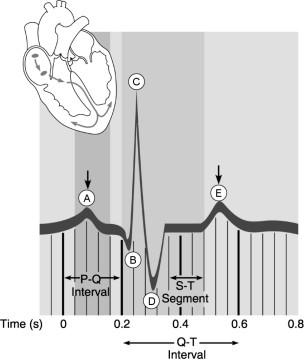
Figure 18.2Using Figure 18.2, match the following:Atrial depolarization.
View Explanation
Verified Answer
Please login to view
Step-by-Step Analysis
To interpret the figure, we first identify the phase of the cardiac cycle associated with atrial depolarization.
- The atrial depolarization is represented on an ECG by the P wave, which occurs just before the ventricles d......Login to view full explanationLog in for full answers
We've collected over 50,000 authentic exam questions and detailed explanations from around the globe. Log in now and get instant access to the answers!
Similar Questions
Match the number on the wave to its function. 1: Number 1 on the wave above represents… ____ 2: Number 4 on the wave above represents... ____
The T wave on an ECG trace is created by the spread of ventricular repolarisation.
Question at position 10 Which letter on the image depicts the S-T segment?BADEFC
In a consumer society, many adults channel creativity into buying things
More Practical Tools for Students Powered by AI Study Helper
Making Your Study Simpler
Join us and instantly unlock extensive past papers & exclusive solutions to get a head start on your studies!