Questions
经济&202 33295 第三章测验
Single choice
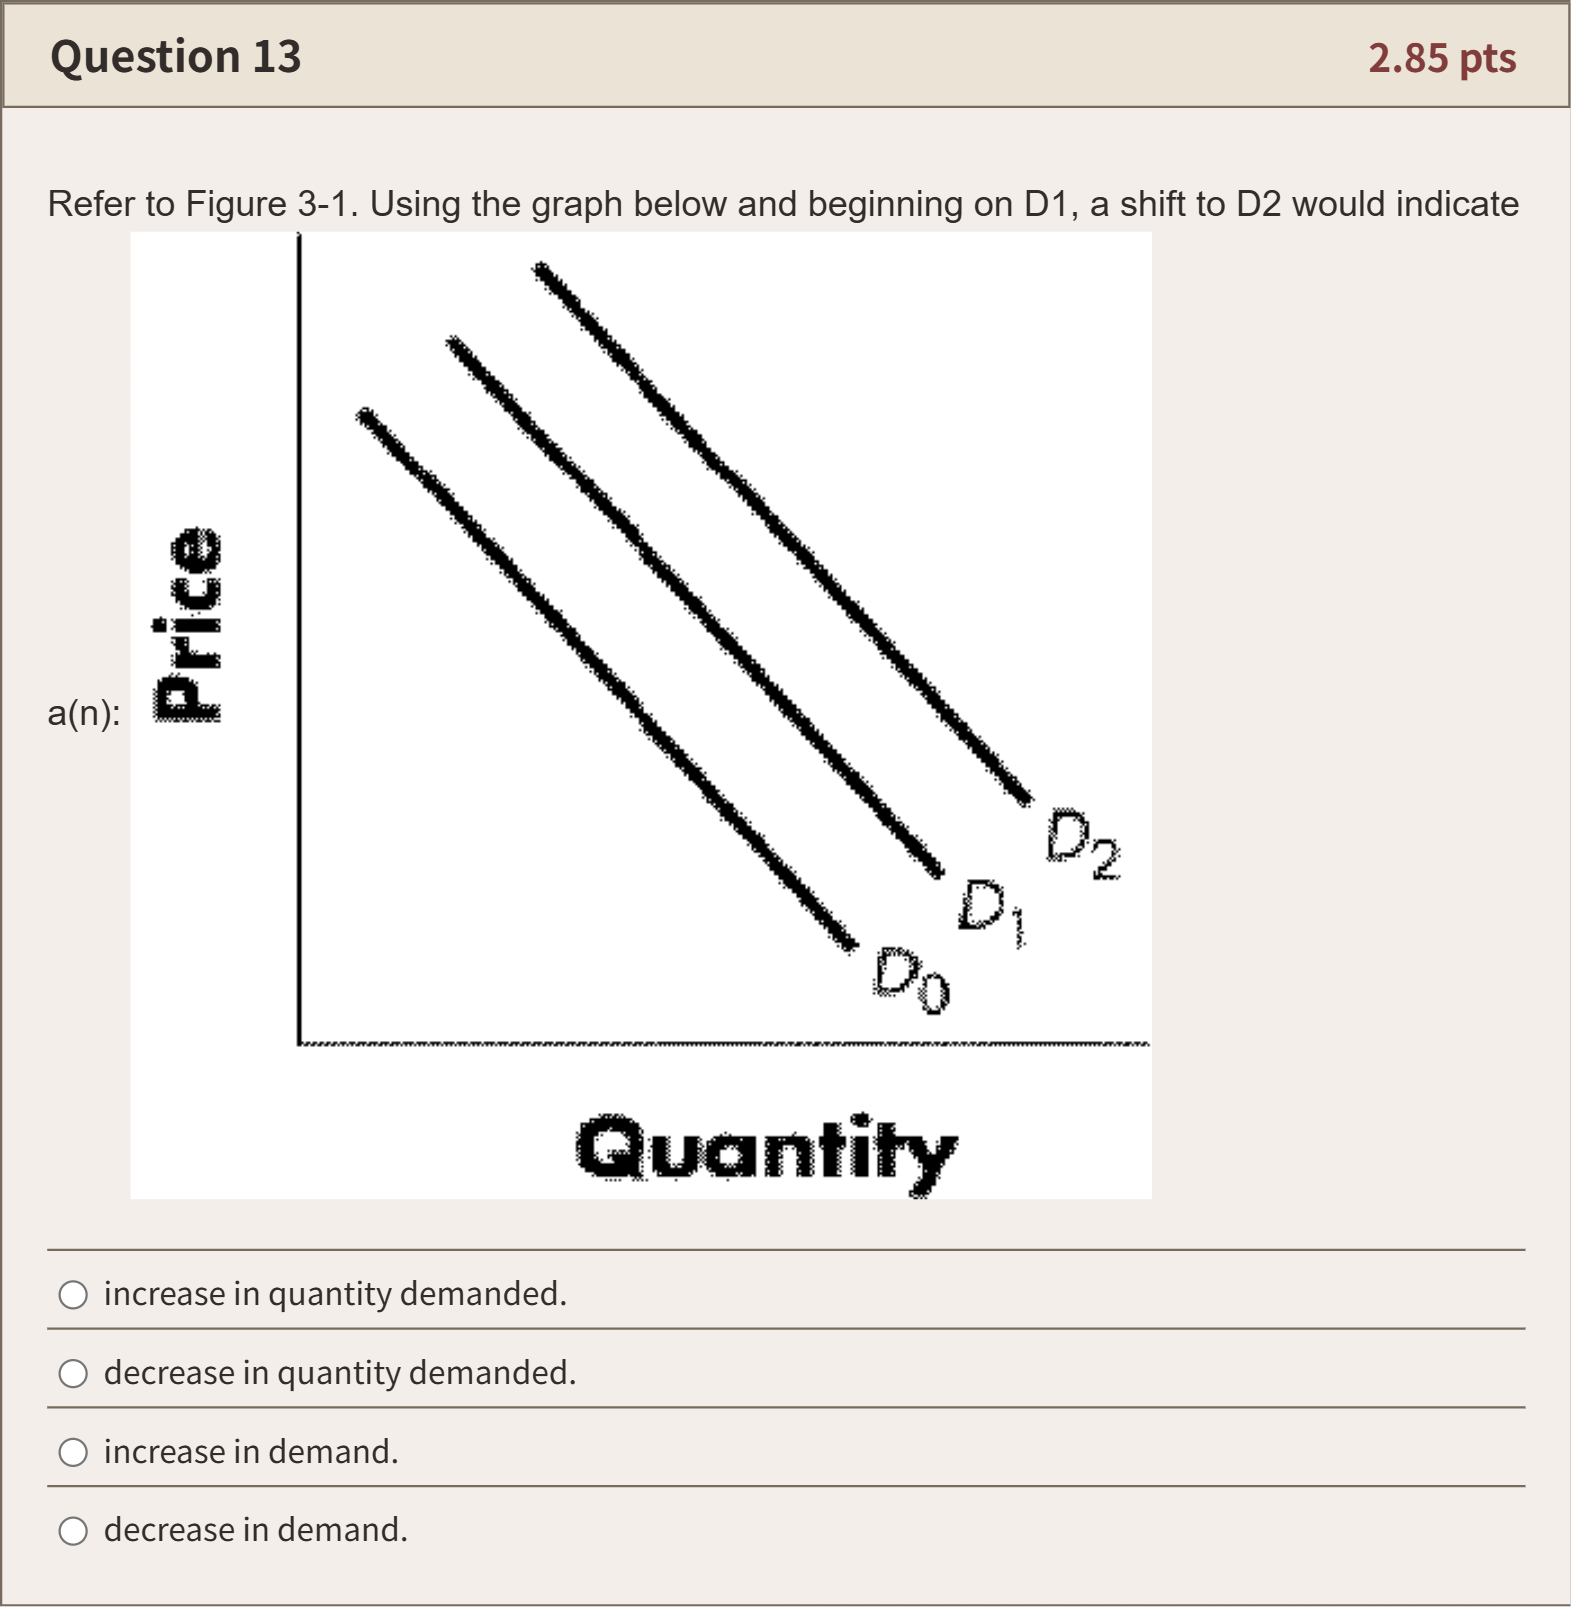
Refer to Figure 3-1. Using the graph below and beginning on D1, a shift to D2 would indicate a(n):
Options
A.increase in quantity demanded.
B.decrease in quantity demanded.
C.increase in demand.
D.decrease in demand.
View Explanation
Verified Answer
Please login to view
Step-by-Step Analysis
To tackle this question, I’ll compare what each option would imply about moving from D1 to D2 on the graph provided.
Option 1: increase in quantity demanded. This phrase describes a movement along a single demand curve due to a price change, not a shift of the entire curve. Since the gra......Login to view full explanationLog in for full answers
We've collected over 50,000 authentic exam questions and detailed explanations from around the globe. Log in now and get instant access to the answers!
Similar Questions
The possible reason for the movement from point A to point B on the figure below is changing ___.
Figure 4-3 Refer to Figure 4-3. The shift from Da to Db is called
Which of the following would shift the demand curve for gasoline to the right?
Part E: A decrease in demand would be represented by a shift from D2 to
More Practical Tools for Students Powered by AI Study Helper
Making Your Study Simpler
Join us and instantly unlock extensive past papers & exclusive solutions to get a head start on your studies!