Questions
Numerical
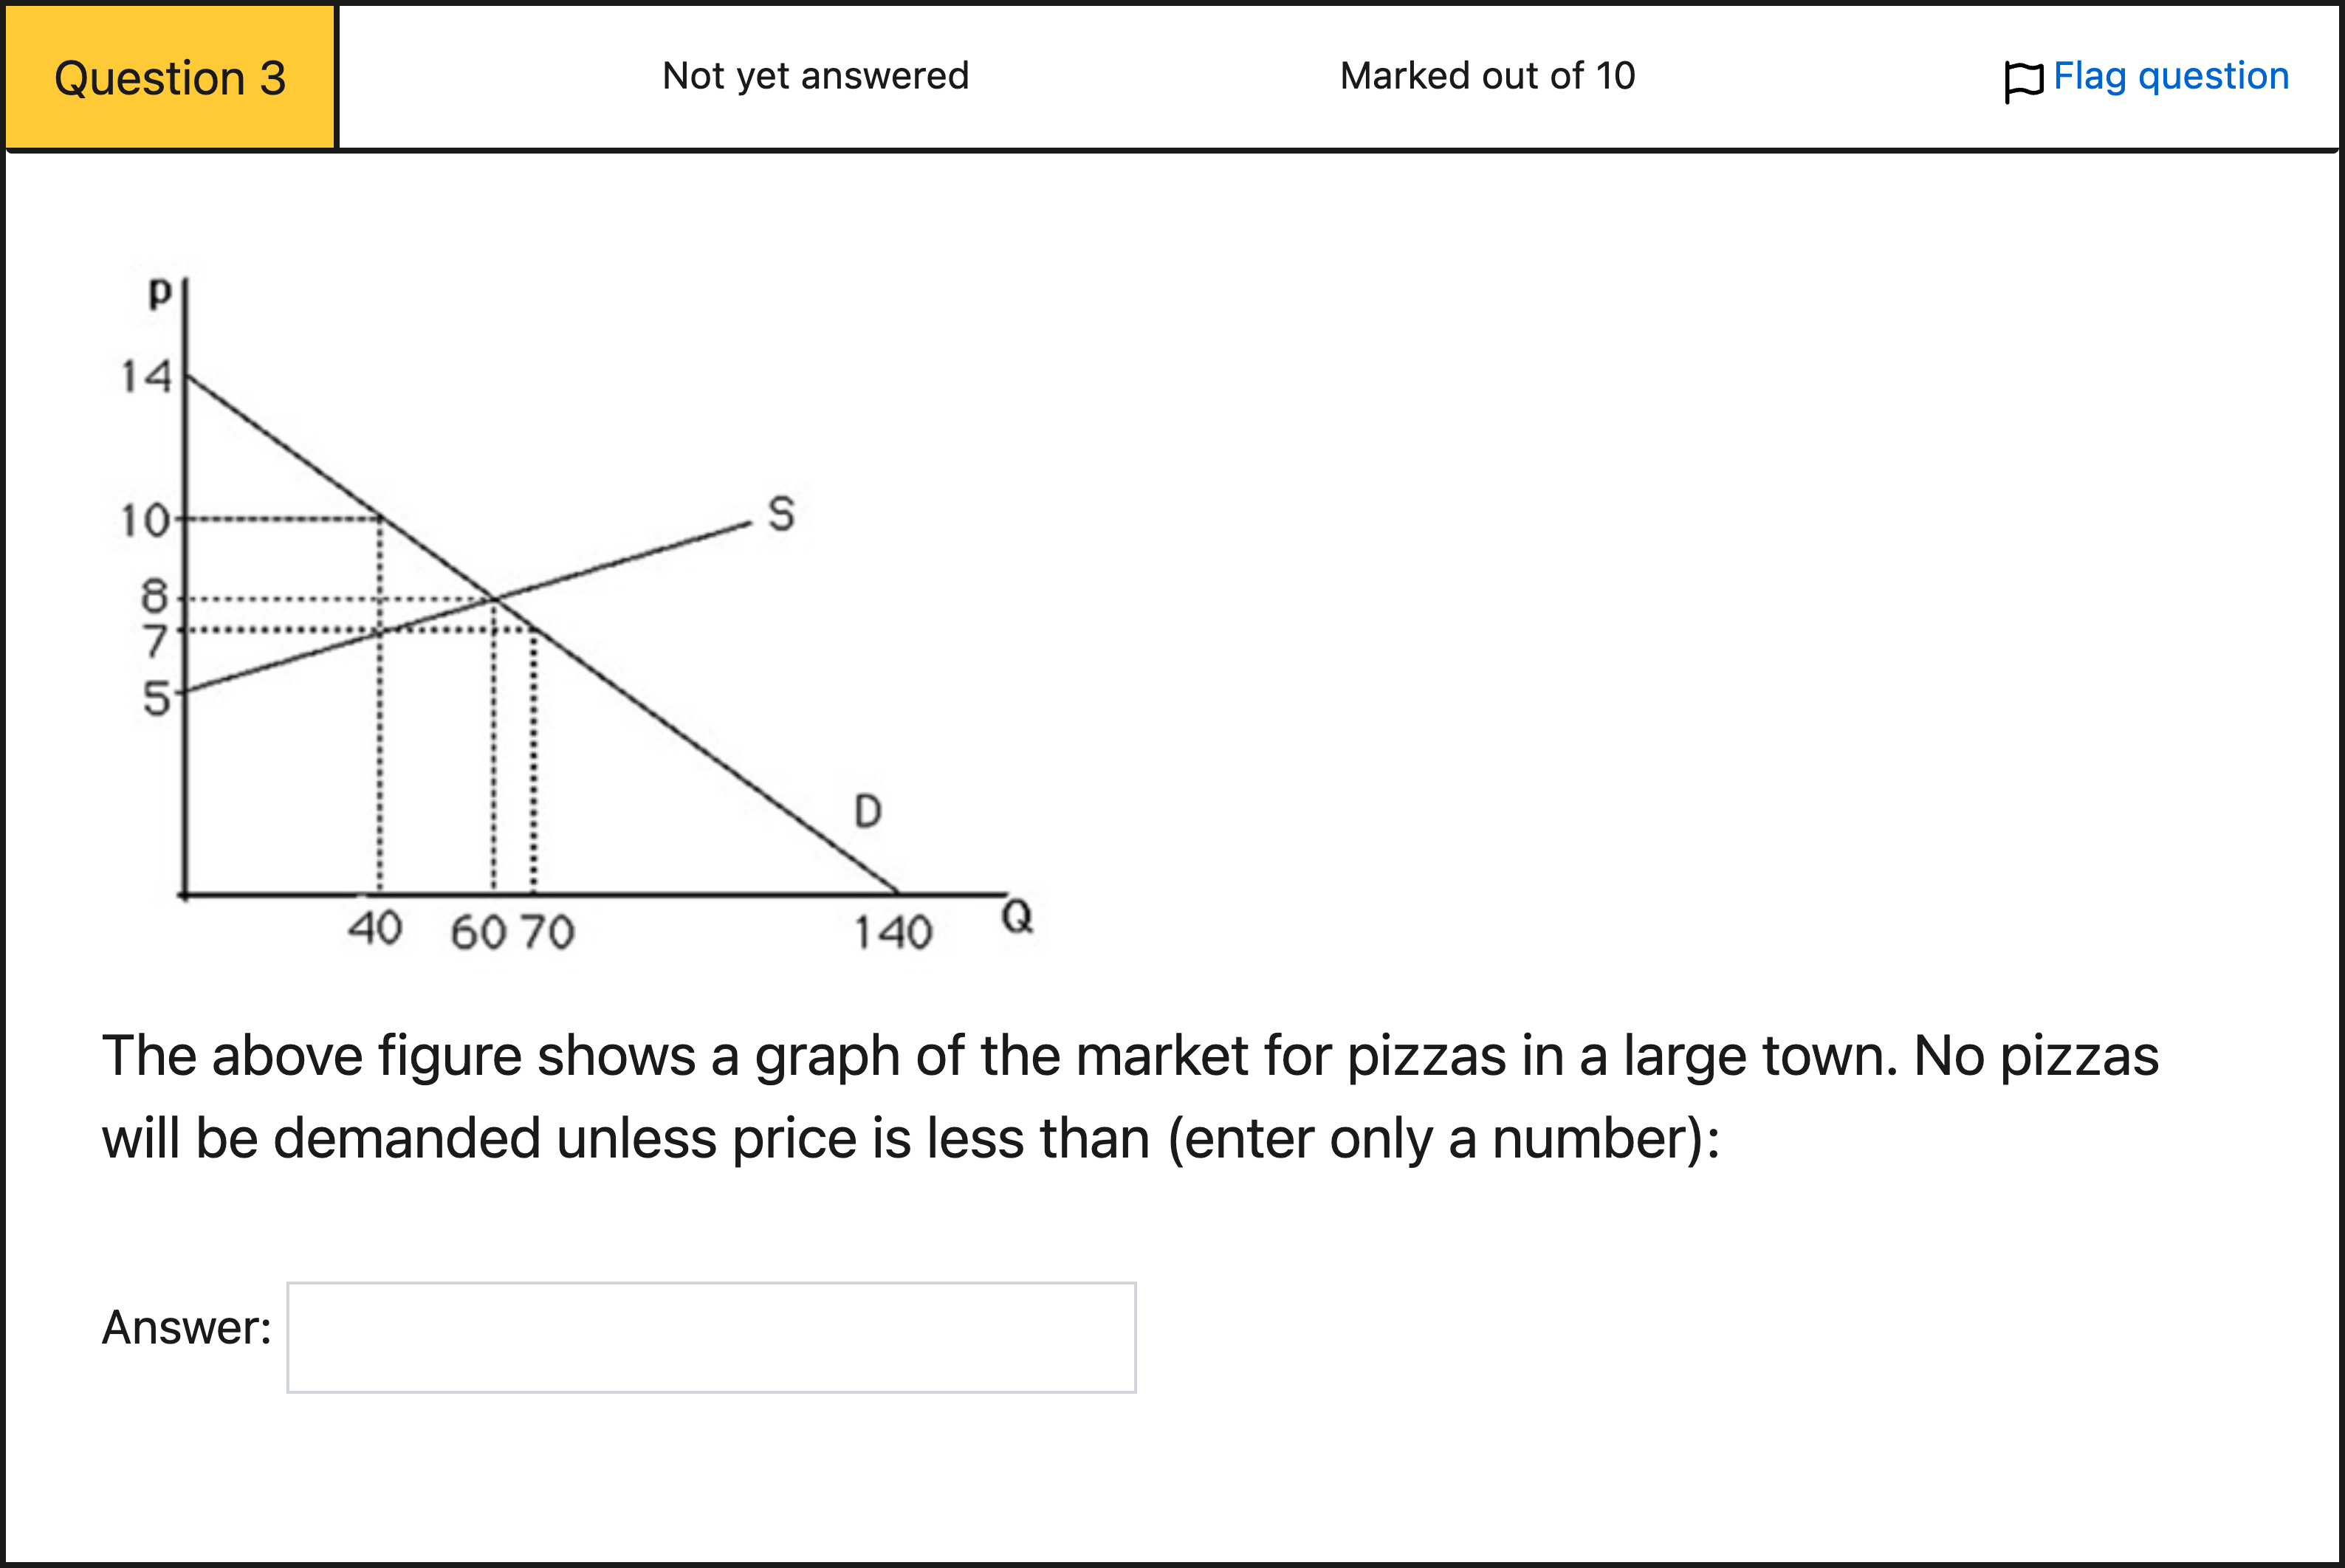
The above figure shows a graph of the market for pizzas in a large town. No pizzas will be demanded unless price is less than (enter only a number):
View Explanation
Verified Answer
Please login to view
Step-by-Step Analysis
To answer this, focus on the statement: no pizzas will be demanded unless price is less than a certain level.
First, look at the vertical axis (price, P) and the demand curve D. The demand curve intersects the price axis at the highest price shown, which represents the ......Login to view full explanationLog in for full answers
We've collected over 50,000 authentic exam questions and detailed explanations from around the globe. Log in now and get instant access to the answers!
Similar Questions
Using the demand schedule below representing a linear demand curve, answer the following question. If the price increases by $20 then the quantity demanded will ____________. Price Quantity $300 15 $250 30 $200 45 $150 60
A demand curve is a graph that relates
According to the Law of Demand, the demand curve for a good will (choose all correct answers):
A decrease in demand shifts the demand curve to the left.
More Practical Tools for Students Powered by AI Study Helper
Making Your Study Simpler
Join us and instantly unlock extensive past papers & exclusive solutions to get a head start on your studies!