Questions
Su25-STATS-141-01/BIO-141-01 Homework 1: Describing data, evidence and sampling methods
Matching
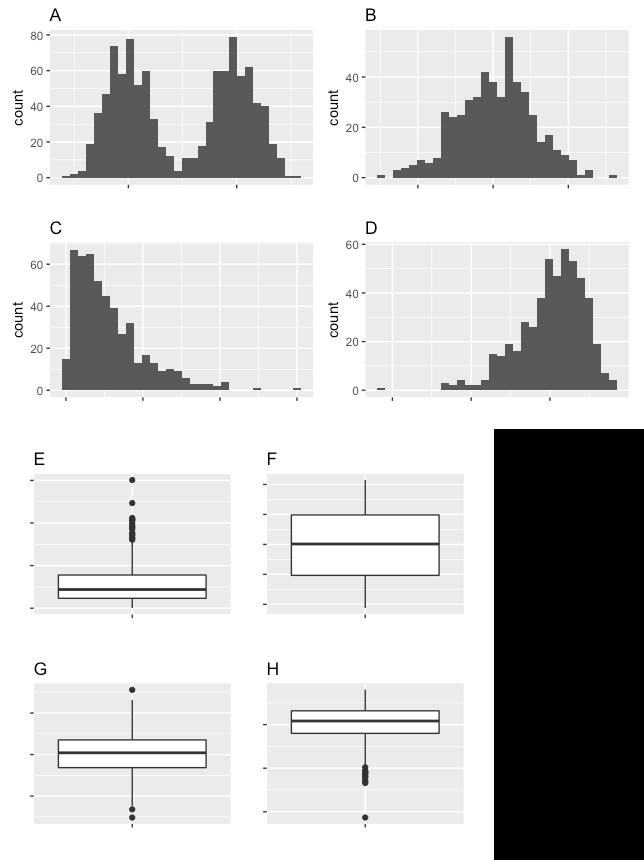
Question Set F Prompt: Match the following histograms to their corresponding boxplots. 1: Histogram A Histogram A 2: Histogram B Histogram B 3: Histogram C Histogram C 4: Histogram D Histogram D
View Explanation
Verified Answer
Please login to view
Step-by-Step Analysis
The task presents a matching exercise where each histogram (A–D) must be paired with a corresponding boxplot (E, F, G, H). Although the answer options aren’t listed in a traditional multiple-choice format, the provided answer array indicates the intended matches: 1 -> Boxplot F, 2 -> Boxplot G, 3 -> Boxplot E, 4 -> Boxplot H.
To reason through these pairings, we compare the key features captured by boxplots with what each histogram suggests about the underlying data distribution, focusing on central tendency, spread, skewness, and potential outliers.
Option 1 (Histogram A) matched with Boxplot F:
- Histogram A appears to show two distinct clusters (a bimodal-ish pattern) or at least a wide spread with possible skewness toward one side. A boxpl......Login to view full explanationLog in for full answers
We've collected over 50,000 authentic exam questions and detailed explanations from around the globe. Log in now and get instant access to the answers!
Similar Questions
回顾一下住房数据集。哪个图最适合可视化像“房屋状况”这样取值范围为 1 到 5 的有序变量的配置?
When reporting descriptive findings to a client, it's important to:
Question at position 16 What is the main advantage of using a dot plot over a bar chart for certain types of data?It can display larger datasets more compactlyIt is better suited for continuous dataIt emphasizes individual data points and their distributionIt is more effective in showing time-series data
位置21的问题 In most cases, a graphical display is more useful than a table for recognizing patterns and 题库 1/1[input].
More Practical Tools for Students Powered by AI Study Helper
Making Your Study Simpler
Join us and instantly unlock extensive past papers & exclusive solutions to get a head start on your studies!