Questions
MUF0052 ICT Unit 2 - Semester 2, 2025 7.7 Quiz: Data science - Supporting a hypothesis
Single choice
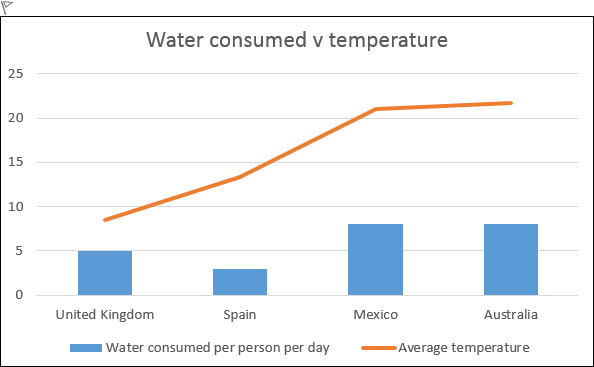
Dexter has constructed the following hypothesis: People in countries that have a higher average temperature always drink more water (per person). Data was collected and the following visualisation created: Which of the following statements is true?
Options
A.a. The data is not relevant to the hypothesis.
B.b. The data partially supports the hypothesis.
C.c. It is unclear if the data supports or refutes the hypothesis.
D.d. The data refutes the hypothesis.
View Explanation
Verified Answer
Please login to view
Step-by-Step Analysis
To evaluate the statement, we need to compare the pattern of water consumption with average temperature across the countries shown.
Option a: 'The data is not relevant to the hypothesis.' The data directly relates to the hypothesis by pairing average temperature with water consumption per person, ......Login to view full explanationLog in for full answers
We've collected over 50,000 authentic exam questions and detailed explanations from around the globe. Log in now and get instant access to the answers!
Similar Questions
The data in the graph reflects a difference in the number of laws that were passed in unified Congresses. The usefulness of this data for comparison is limited by which of the following?
Question textMatch the following statistics A-G to the four statements listed below. There are THREE options that you will NOT use. [table] A. | 70% B. | 7 Years C. | 60% D. | 3 billion E. | 24 hours F. | 26 million G. | 10.9 million [/table] Statement 1: The percentage reduction in time of 3D printing a 2-storey granny flat Answer 1 Question 1[select: , A, B, C, D, E, F, G] Statement 2: The number of houses or apartments in Australia today Answer 2 Question 1[select: , A, B, C, D, E, F, G] Statement 3: The number of people who will need housing in the world by 2030 Answer 3 Question 1[select: , A, B, C, D, E, F, G] Statement 4: The amount of time it takes to 3D print a house Answer 4 Question 1[select: , A, B, C, D, E, F, G]
In more than half of the countries represented in the graph, the minimum-wage is below $100 per month.
Which is the best overall statement for the graph ‘Minimum Wage, by Country’?
More Practical Tools for Students Powered by AI Study Helper
Making Your Study Simpler
Join us and instantly unlock extensive past papers & exclusive solutions to get a head start on your studies!