Questions
ECC2000 - ECC5900 - S2 2025 Sample final exam
Single choice
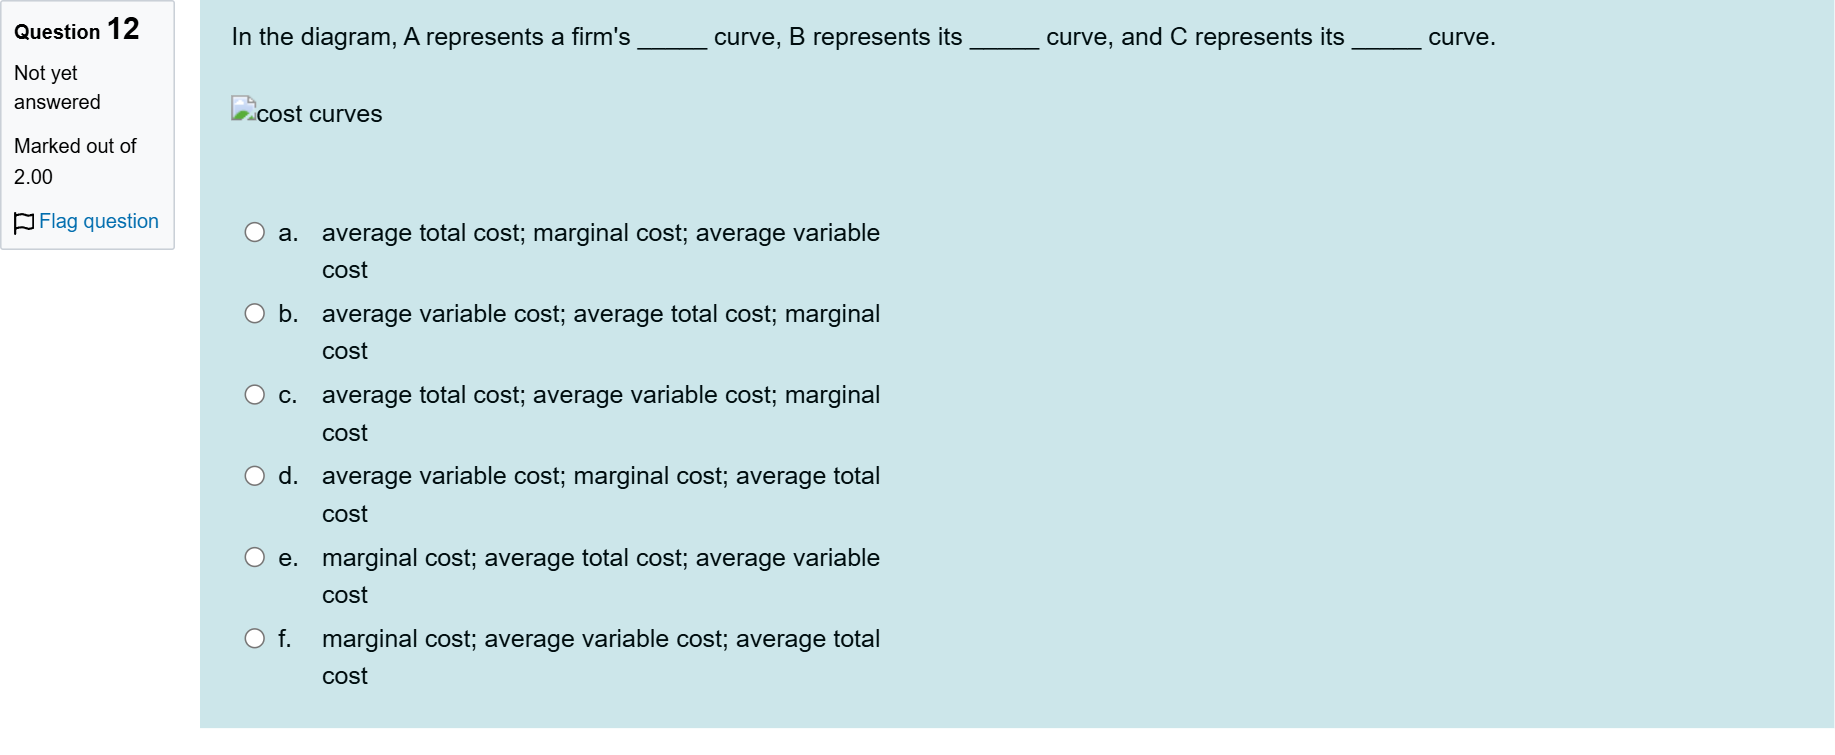
In the diagram, A represents a firm's _____ curve, B represents its _____ curve, and C represents its _____ curve.
Options
A.a. average total cost; marginal cost; average variable cost
B.b. average variable cost; average total cost; marginal cost
C.c. average total cost; average variable cost; marginal cost
D.d. average variable cost; marginal cost; average total cost
E.e. marginal cost; average total cost; average variable cost
F.f. marginal cost; average variable cost; average total cost
View Explanation
Verified Answer
Please login to view
Step-by-Step Analysis
Take a careful look at what each labeled curve typically represents in cost diagrams.
Option a: 'average total cost; marginal cost; average variable cost' assigns A to average total cost, B to marginal cost, and C to average variable cost. In standard cost diagrams, the B curve is usually either average variable cost or marginal cost depending on the context, but the order here swaps marginal and average variable in a way that does not align with how the three curves are usually labeled together (A, B, C) for concise identification. This misordering makes this option unlikely.
Option b: 'average variable......Login to view full explanationLog in for full answers
We've collected over 50,000 authentic exam questions and detailed explanations from around the globe. Log in now and get instant access to the answers!
Similar Questions
If a firm's average total cost decreases as the firm increases its output, the firm's marginal cost must be
When the average total cost curve is at its minimum, we know that the
In the short run, ATC curve and AVC curve converge as output increases because
When the average variable cost curve is upward sloping, the marginal cost curve:
More Practical Tools for Students Powered by AI Study Helper
Making Your Study Simpler
Join us and instantly unlock extensive past papers & exclusive solutions to get a head start on your studies!