Still overwhelmed by exam stress? You've come to the right place!
We know exam season has you totally swamped. To support your studies, access Gold Membership for FREE until December 31, 2025! Normally £29.99/month. Just Log In to activate – no strings attached.
Let us help you ace your exams efficiently!
Questions
MGS*3100*W05 25 Fall OM Final - Requires Respondus LockDown Browser
Single choice
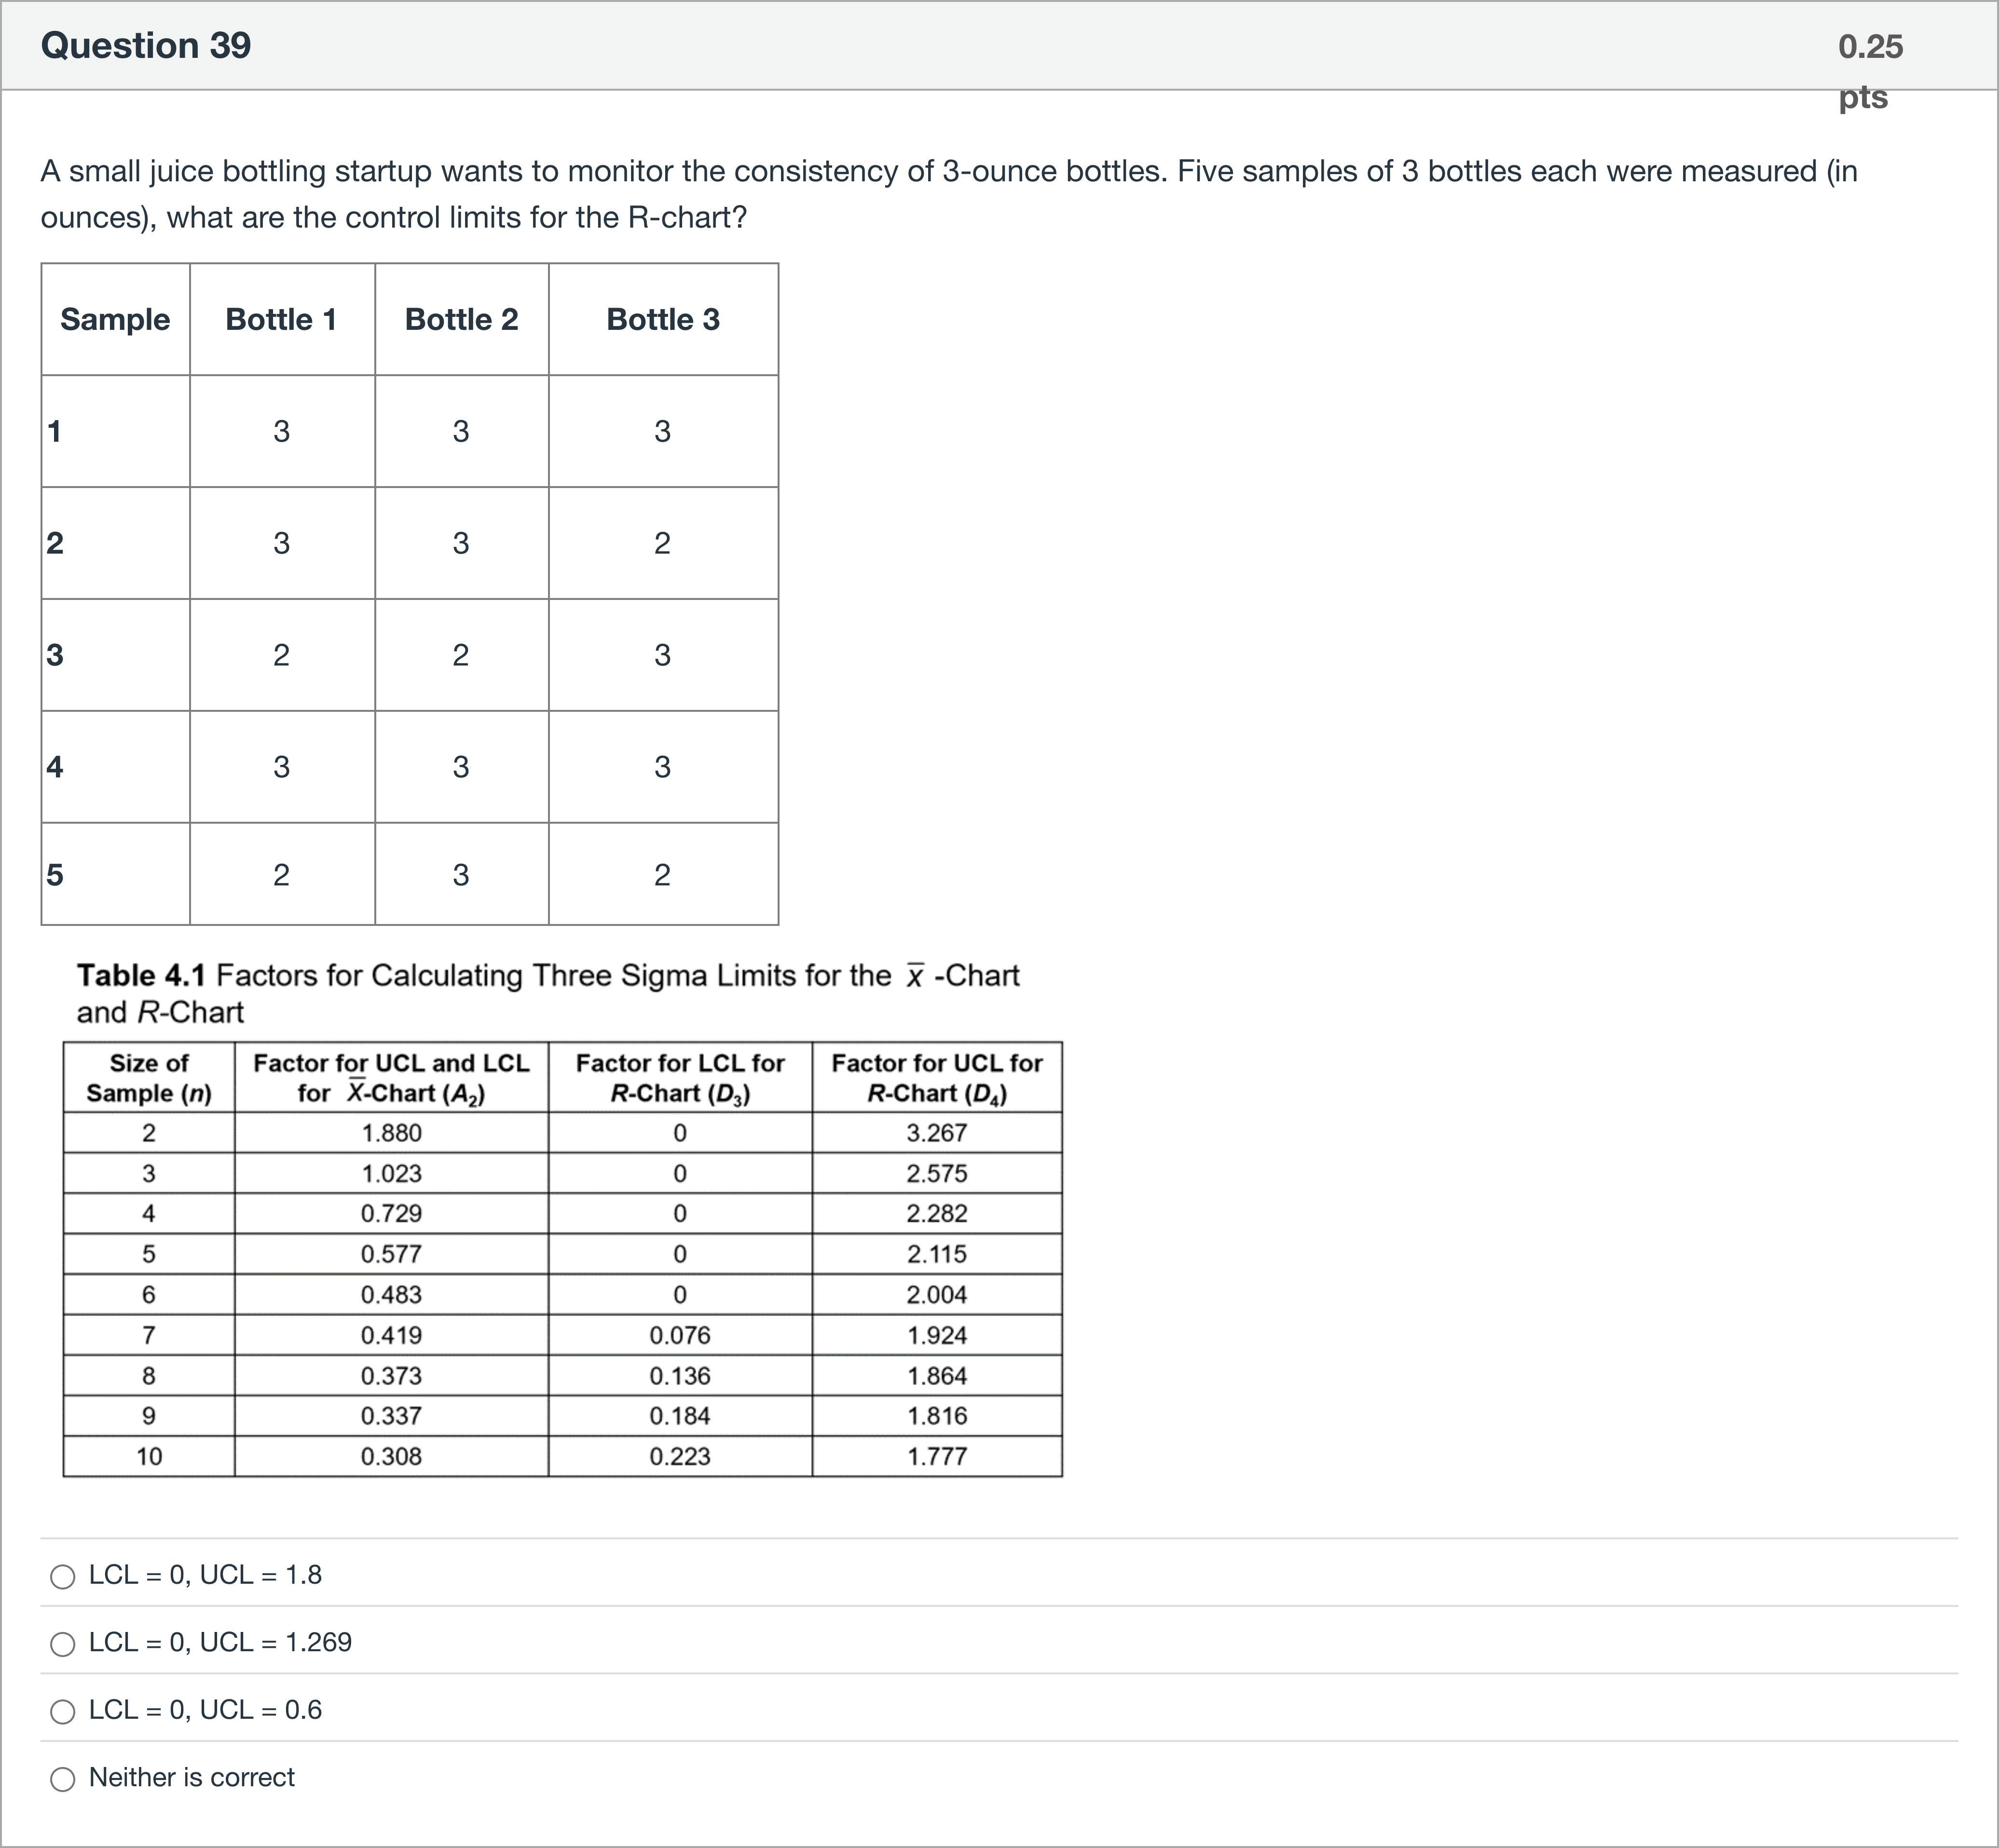
A small juice bottling startup wants to monitor the consistency of 3-ounce bottles. Five samples of 3 bottles each were measured (in ounces), what are the control limits for the R-chart? Sample Bottle 1 Bottle 2 Bottle 3 1 3 3 3 2 3 3 2 3 2 2 3 4 3 3 3 5 2 3 2
Options
A.LCL = 0, UCL = 1.8
B.LCL = 0, UCL = 1.269
C.LCL = 0, UCL = 0.6
D.Neither is correct
View Explanation
Standard Answer
Please login to view
Approach Analysis
First, we extract the problem data and compute the necessary statistics for the R-chart.
- Sample data (n=3) across 5 samples yields the following within-sample ranges (R): sample1: 0, sample2: 1, sample3: 1, sample4: 0, sample5: 1.
- The average range, R-bar, is (0 + 1 + 1 + 0 + 1) / 5 = 3/5 = 0.6.
Next, we recall how the R-chart control limits are determined. For an R-chart, the lower control limit (LCL) is typically D3 multiplied by R-bar, and the upper control limit (UCL) is D4 multiplied by R-bar, where D3 a......Login to view full explanationLog in for full answers
We've collected over 50,000 authentic exam questions and detailed explanations from around the globe. Log in now and get instant access to the answers!
Similar Questions
To depict average cost per meal, including an upper and lower limit, it would be best to use a:
A small juice bottling startup wants to monitor the consistency of 3-ounce bottles. Five samples of 3 bottles each were measured (in ounces), what are the control limits for the R-chart? Sample Bottle 1 Bottle 2 Bottle 3 1 3 3 3 2 3 3 2 3 2 2 3 4 3 3 3 5 2 3 2
What is the main difference between C-chart and P-chart?
What is the main difference between C-chart and P-chart?
More Practical Tools for International Students
Making Your Study Simpler
To make preparation and study season easier for more international students, we've decided to open up Gold Membership for a limited-time free trial until December 31, 2025!