Questions
STATS 101/108 Chapter 1 quiz
Multiple fill-in-the-blank
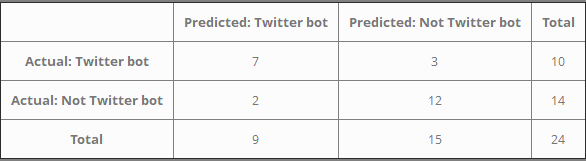
A model was developed to classify whether or not tweets were written by a Twitter bot. The results from using the classification model on 24 tweets are shown below in the confusion matrix. Use the confusion matrix to answer the following questions. Give your answers as percentages rounded to one decimal place e.g. 23.1% or 42.0%. The accuracy of the classification model (PCC) was [Fill in the blank], %. [Fill in the blank], % of the tweets were predicted to be written by a bot. Of the tweets that were actually written by a bot, [Fill in the blank], % were correctly predicted to be written by bot. Of the tweets that were actually written by a bot, [Fill in the blank], % were incorrectly predicted to not be written by bot.
View Explanation
Verified Answer
Please login to view
Step-by-Step Analysis
First, I will restate the given data from the confusion matrix to ensure we’re working with the correct numbers. The matrix shows:
- Actual Twitter bot: predicted as bot = 7, predicted as not bot = 3, total = 10
- Actual Not Twitter bot: predicted as bot = 2, predicted as not bot = 12, total = 14
- Totals by predictions: predicted bot = 9, predicted not bot = 15, overall total = 24
Now, I’ll examine each fill-in-the-bl......Login to view full explanationLog in for full answers
We've collected over 50,000 authentic exam questions and detailed explanations from around the globe. Log in now and get instant access to the answers!
Similar Questions
Question 1: Define the test status (TP/TN/FP/FN) of the cows in the following table. (5 marks) Cow Number Date Gold standard (Milk progesterone) Peak activity change Threshold: Peak activity change at least one day >30 3 days blockThreshold>30 Test status 1219 4/11/2013 1 87 1 1 [Fill in the blank] 1219 5/11/2013 1 9 0 1219 6/11/2013 1 2 0 1219 16/11/2013 0 6 0 0 [Fill in the blank] 1219 17/11/2013 0 4 0 1219 18/11/2013 0 4 0 1219 19/11/2013 0 35 1 1 [Fill in the blank] 1219 20/11/2013 0 4 0 1219 21/11/2013 0 -1 0 1219 22/11/2013 0 4 0 0 [Fill in the blank] 1219 23/11/2013 0 2 0 1219 24/11/2013 0 12 0 1286 10/11/2013 1 1 0 0 [Fill in the blank] 1286 11/11/2013 1 -2 0 1286 12/11/2013 1 11 0 1306 4/11/2013 0 13 0 0 [Fill in the blank] 1306 5/11/2013 0 23 0 1306 6/11/2013 0 7 0 1306 19/11/2013 1 38 1 1 [Fill in the blank] 1306 20/11/2013 1 4 0 1306 21/11/2013 1 0 0 1399 25/11/2013 1 6 0 0 [Fill in the blank] 1399 26/11/2013 1 1 0 1399 27/11/2013 1 24 0 1431 19/11/2013 0 22 0 0 [Fill in the blank] 1431 20/11/2013 0 13 0 1431 21/11/2013 0 0 0 1460 4/11/2013 1 27 0 0 [Fill in the blank] 1460 5/11/2013 1 4 0 1460 6/11/2013 1 2 0
Consider the targeted marketing campaign case of selling products through promotional catalogs. The following tables show the confusion matrices of the classification tree model and the logit regression model, which classifies customers into 'likely to respond' (positive) and 'not likely to respond' (negative). Confusion Matrix of the Classification Tree Model: p (actual) n (actual) p (predicted) 10 4 n (predicted) 3 15 Confusion Matrix of the Logit Regression Model: p (actual) n (actual) p (predicted) 13 5 n (predicted) 2 12 Which model is more accurate (higher accuracy rate) based on the information given in these confusion matrices?
Which factor(s) will increase when the prediction agrees with the gold standard.
The sum true positives + false negatives equals:
More Practical Tools for Students Powered by AI Study Helper
Making Your Study Simpler
Join us and instantly unlock extensive past papers & exclusive solutions to get a head start on your studies!