Questions
SIPAIA6400_001-002_2025_3 - Microeconomic Analysis for International and Public Affairs
Single choice
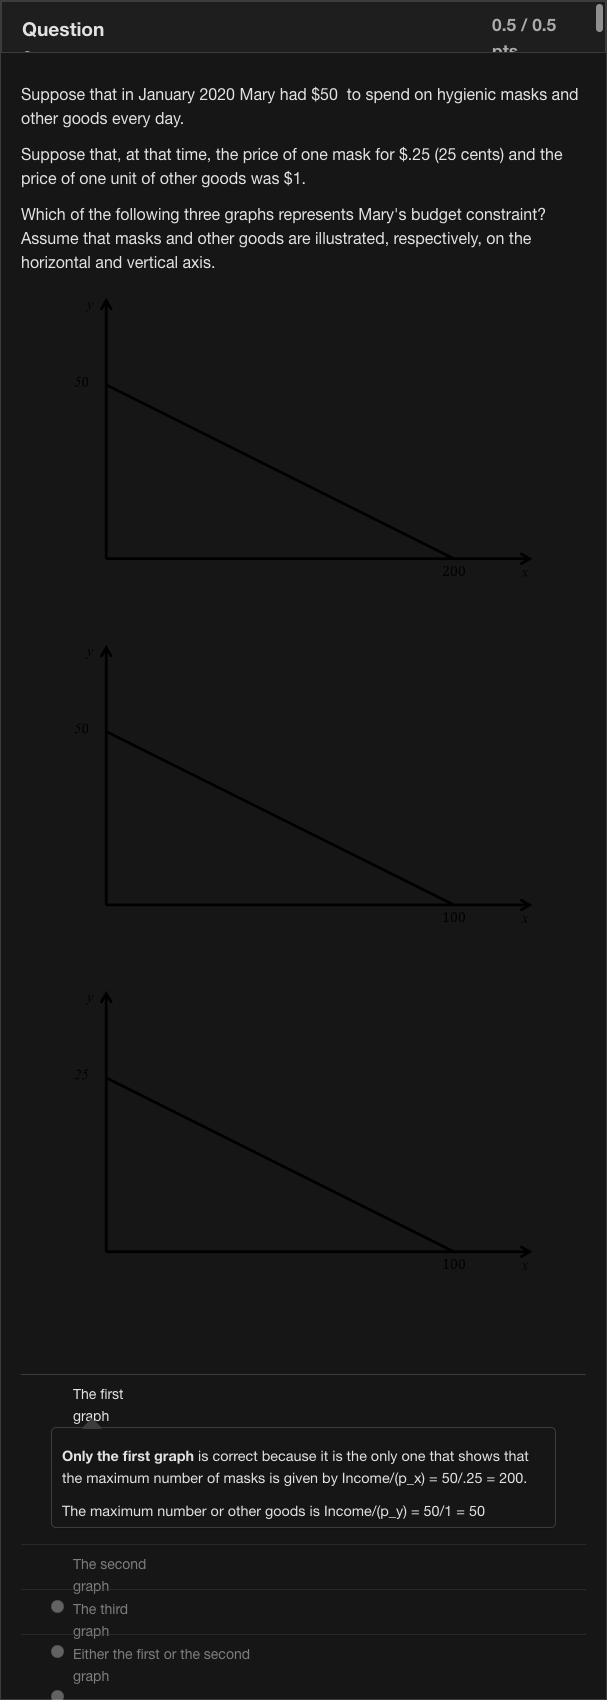
Suppose that in January 2020 Mary had $50 to spend on hygienic masks and other goods every day. Suppose that, at that time, the price of one mask for $.25 (25 cents) and the price of one unit of other goods was $1. Which of the following three graphs represents Mary's budget constraint? Assume that masks and other goods are illustrated, respectively, on the horizontal and vertical axis.
View Explanation
Verified Answer
Please login to view
Step-by-Step Analysis
To determine Mary’s budget constraint, we start by identifying the prices and the income. The budget equation is 0.25*M + 1*O = 50, where M is the number of masks (horizontal axis) and O is the amount of other goods (vertical axis).
From this equation, the maximum numbe......Login to view full explanationLog in for full answers
We've collected over 50,000 authentic exam questions and detailed explanations from around the globe. Log in now and get instant access to the answers!
Similar Questions
Why do people need to make economic choices?
Combinations to the left of the budget line are
[Continuation of question 13] If the price of food doubles to $2 per unit, the price of other goods remains at $1, and Tom's income increases to $150, would Tom still afford the original optimal basket of question 1 (x = 50 and y = 50)?
Lisa's optimal basket cannot be to the South West of her budget line
More Practical Tools for Students Powered by AI Study Helper
Making Your Study Simpler
Join us and instantly unlock extensive past papers & exclusive solutions to get a head start on your studies!