Questions
Single choice
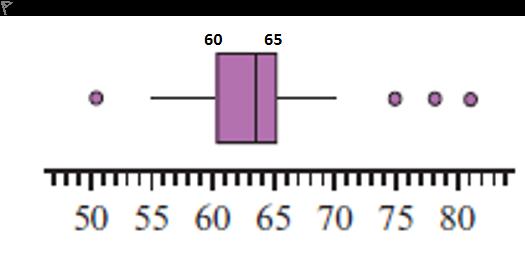
For the data represented by the boxplot above, the percentage of data values greater than 65 is:
Options
A.a. 75%
B.b. 50%
C.c. 25%
D.d. 2.5%
View Explanation
Verified Answer
Please login to view
Step-by-Step Analysis
To interpret the boxplot, identify the quartiles: the right edge of the box represents Q3, the 75th percentile, which in this plot is at 65. The portion of data ab......Login to view full explanationLog in for full answers
We've collected over 50,000 authentic exam questions and detailed explanations from around the globe. Log in now and get instant access to the answers!
Similar Questions
You are a newly employed data scientist working at Google! Your team is responsible for analysing user engagement. One of the key metrics your team tracks is the number of daily active users (DAUs) across different regions. You have the dataset, google_dau, which contains the following columns: Date: Date of the observation (e.g. 2024-07-01, 2024-07-02...) Region: Region of the users (North America, Europe, Asia) DAUs: Number of daily active users (e.g. 10000, 11000...) What code best matches the following graph (assuming you have loaded the necessary packages)?
You are a newly employed data scientist working at Google! Your team is responsible for analysing user engagement. One of the key metrics your team tracks is the number of daily active users (DAUs) across different regions. You have the dataset, google_dau, which contains the following columns: Date: Date of the observation (e.g. 2024-07-01, 2024-07-02...) Region: Region of the users (North America, Europe, Asia) DAUs: Number of daily active users (e.g. 10000, 11000...) What code best matches the following graph (assuming you have loaded the necessary packages)?
Determine whether this statement is True or False or Can't Tell. A boxplot is a useful summary of a bimodal distribution. False
In the iris dataset in R, how would you visualise the relationship between Species and Petal.Length?
More Practical Tools for Students Powered by AI Study Helper
Making Your Study Simpler
Join us and instantly unlock extensive past papers & exclusive solutions to get a head start on your studies!