Questions
ECO101H1 S LEC0101 topic quiz: behind the supply curve
Numerical
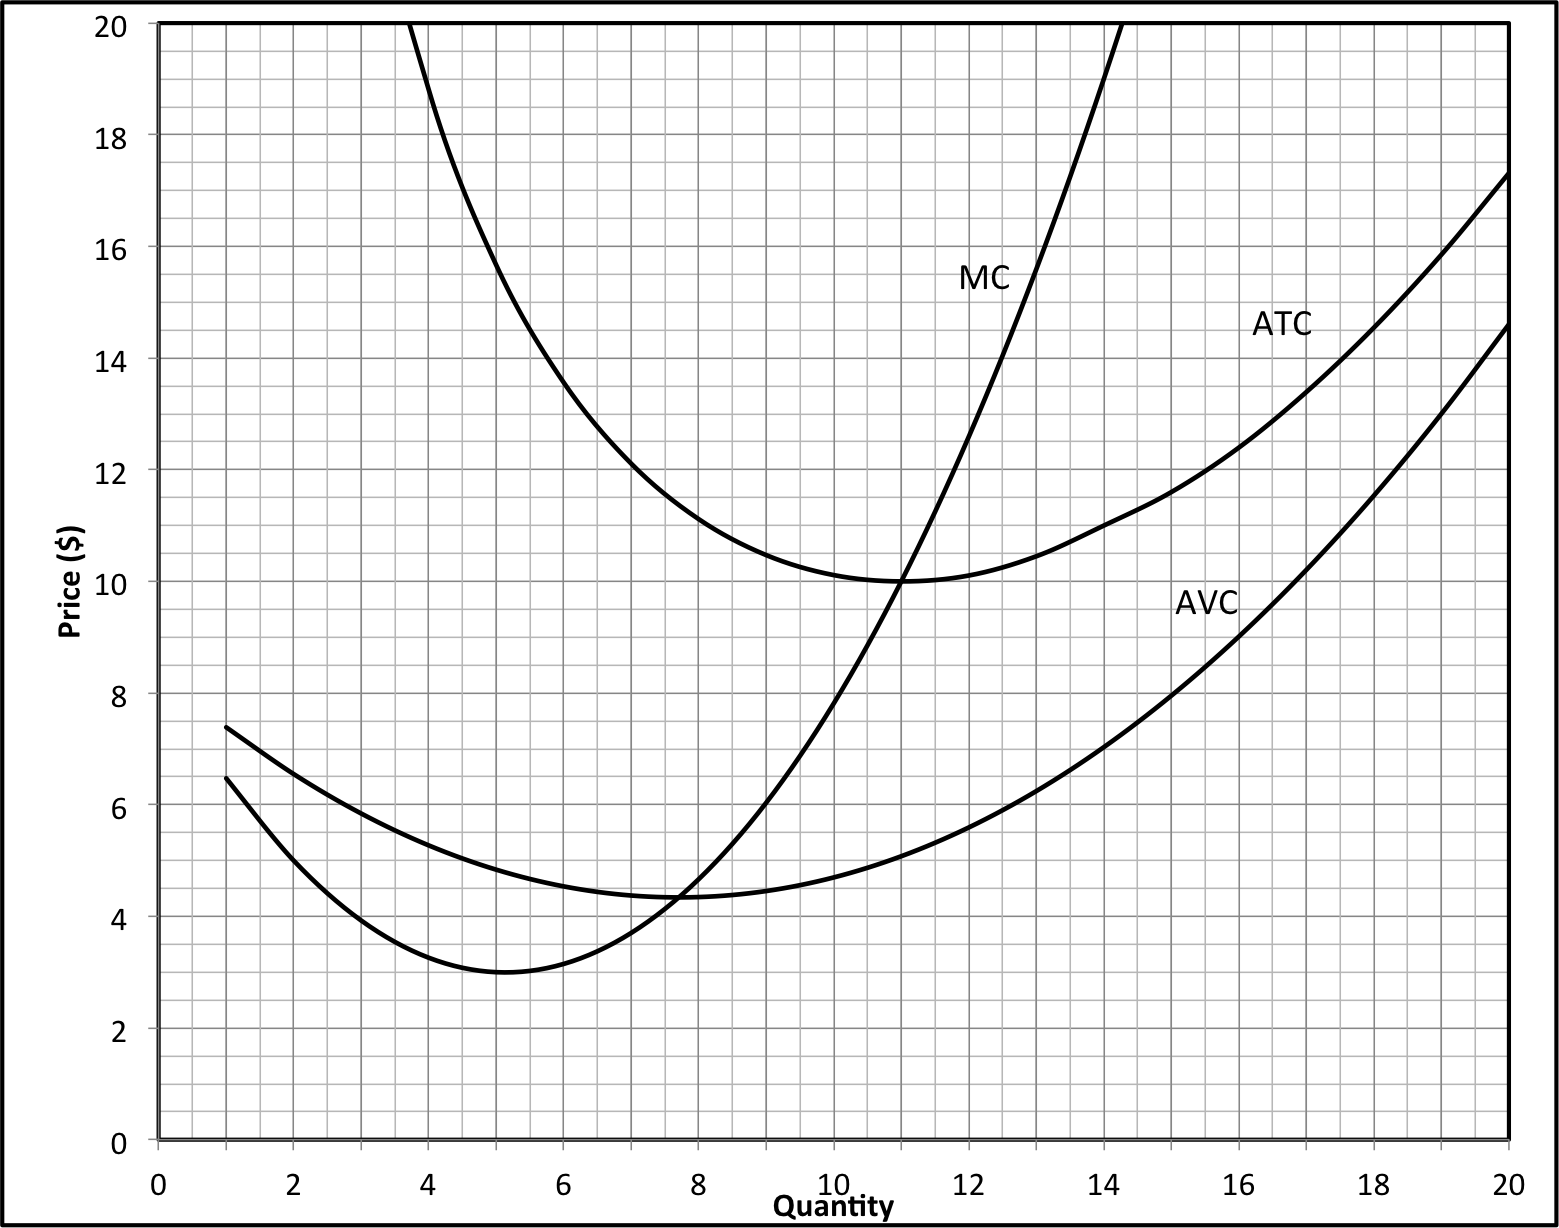
Refer to the figure below. What are average fixed costs at q=9? (Remember, do not enter the $ sign.)
View Explanation
Verified Answer
Please login to view
Step-by-Step Analysis
To determine average fixed costs (AFC) at q = 9, we rely on the AFC curve shown in the figure. AFC is defined as total fixed cost (FC) divided by quantity (q): AFC = FC / q.
First, we read the AFC value at q = 9 from the graph. The AFC curve (the downward-sloping one labeled AFC) appears to be......Login to view full explanationLog in for full answers
We've collected over 50,000 authentic exam questions and detailed explanations from around the globe. Log in now and get instant access to the answers!
Similar Questions
An average fixed cost will
Part 1Draw an average fixed cost curve. Label it. Click toenlargegraph Part 1Why does the AFC curve have this shape?The AFC curve has this shape because _______. A. when output increases, total fixed cost decreases B. when output increases, total fixed cost increases C. it reflects diminishing returns D. when output increases, the firm spreads its total fixed cost over a larger output Part 1 0246810048121620Output (gift baskets per day)Cost (dollars per basket) AFCAFC Edit coordinates interactive graph>>> Draw only the objects specified in the question.
9. The average fixed cost ____________ when the quantity produced ____________
8. Given the data below on labor and output in the short run: L Q 1 10 2 18 3 24 Suppose that the capital is fixed at K=4. If the rent R is $4 and the wage W is $8, then the average fixed cost of producing 10 units is
More Practical Tools for Students Powered by AI Study Helper
Making Your Study Simpler
Join us and instantly unlock extensive past papers & exclusive solutions to get a head start on your studies!