Questions
Phys_2305_O'Donnell_Fall2025 Quiz 01 - Chapters 1 & 2, Chapter 3 (3.1-3.2)
Single choice
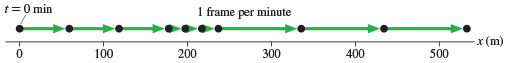
Referring to Figure 1.10 in Chapter 1 of the text (reproduced below), compare the magnitudes of the average accelerations for Hare and the Tortoise.
View Explanation
Verified Answer
Please login to view
Step-by-Step Analysis
The task asks us to compare the magnitudes of the average accelerations for Hare and the Tortoise using the figure provided.
First, recall what average acceleration means: it is the change in velocity over a time interval, not directly a change in position. To determine average acceleration from a graph, you would typically need either a velocity–time graph or data that allows you to compute velocity at multiple times and then tak......Login to view full explanationLog in for full answers
We've collected over 50,000 authentic exam questions and detailed explanations from around the globe. Log in now and get instant access to the answers!
Similar Questions
Question at position 3 In Example 16 (p. 49), what is the cyclist's average acceleration for the entire trip (i.e., from 0 s to 1800 s)? -2 ms2\frac{m}{s^2}-1 ms2\frac{m}{s^2}-0.0006 ms2\frac{m}{s^2}0 ms2\frac{m}{s^2}0.0006 ms2\frac{m}{s^2}1 ms2\frac{m}{s^2}2 ms2\frac{m}{s^2}Clear my selection
Calculate average acceleration from 0 to 40 m. NOTE: SI unit symbol must be provided and round to three (3) significant figures.
A car increases its speed from 9.5 meters per second to 13.6 meters per second in 3.3 seconds. What is the average acceleration of the car during this time interval?
A car increases its speed from 8.4 meters per second to 11.7 meters per second in 4.3 seconds. What is the average acceleration of the car during this time interval?
More Practical Tools for Students Powered by AI Study Helper
Making Your Study Simpler
Join us and instantly unlock extensive past papers & exclusive solutions to get a head start on your studies!