Questions
STAT_V 443 202 2024W2 Activity 5: Autoregressive Processes
Matching
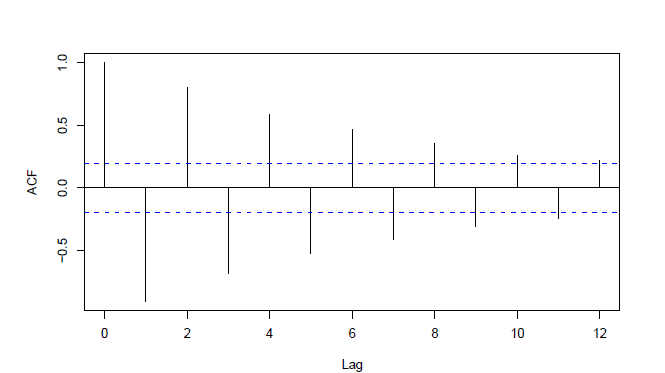
(On Problem 7 of the worksheet) Identify which autocorrelation plot corresponds to each value of 𝛼 . Plot 1: Plot 2: Plot 3: Plot 4: 1: Plot 1 2: Plot 2 3: Plot 3 4: Plot 4
Options
A.0.9
B.0
C.0.5
D.-0.9
View Explanation
Verified Answer
Please login to view
Step-by-Step Analysis
We are asked to identify which autocorrelation (ACF) plot corresponds to each value of α, given the four plots and the answer options.
First, recall how autocorrelation behaves for different α values in simple time-series models: a large positive α (like 0.9) tends to produce strong positive autocorrelation at small lags, a moderate positive α (like 0.5) yields a noticeable but less pronounced positive autocorrelation at several lags, an α of 0 generally yields no significant autocorrelations beyond lag 0 (the ACF values beyond lag 0 hover around zero within the confidence bands), and a large negative α (like -0.9) produces strong negative autocorrelations at small lags.
Now examine eac......Login to view full explanationLog in for full answers
We've collected over 50,000 authentic exam questions and detailed explanations from around the globe. Log in now and get instant access to the answers!
Similar Questions
What is a fundamental difference between typical time series data and cross-sectional data that violates a standard OLS assumption?
Autocovariance in residuals of time series regression indicates that OLS should never be applied to estimate coefficients
A classical ordinary least squares (OLS) cannot be applied if the dependent variable exhibits autocovariance
If the d-statistic in the Durbin-Watson Test is 0.5,
More Practical Tools for Students Powered by AI Study Helper
Making Your Study Simpler
Join us and instantly unlock extensive past papers & exclusive solutions to get a head start on your studies!