Questions
DEV3011 S1 2025 Week 12 Self Quiz
Single choice
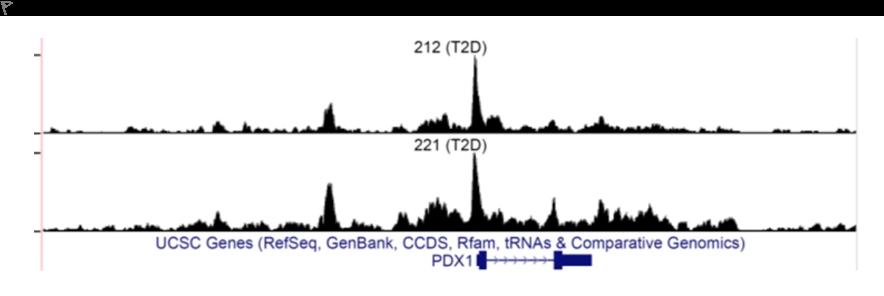
Observe the data shown below. What is being shown?
Options
A.a. ATAC-seq
B.b. scRNA-seq
C.c. Linkage analysis
D.d. RNA-seq
View Explanation
Verified Answer
Please login to view
Step-by-Step Analysis
The task asks us to identify what type of data is being shown in the figure.
Option a. ATAC-seq: This method produces chromatin accessibility profiles with narrow, sharp peaks across the genome, often aligned to gene loci and annotated with nearby genes (as seen with UCSC Genes). The plot displays multiple tall peaks at a locus with l......Login to view full explanationLog in for full answers
We've collected over 50,000 authentic exam questions and detailed explanations from around the globe. Log in now and get instant access to the answers!
More Practical Tools for Students Powered by AI Study Helper
Making Your Study Simpler
Join us and instantly unlock extensive past papers & exclusive solutions to get a head start on your studies!