Questions
MGS*3100*01.2025FA Test 03: Chap 10,11
Single choice
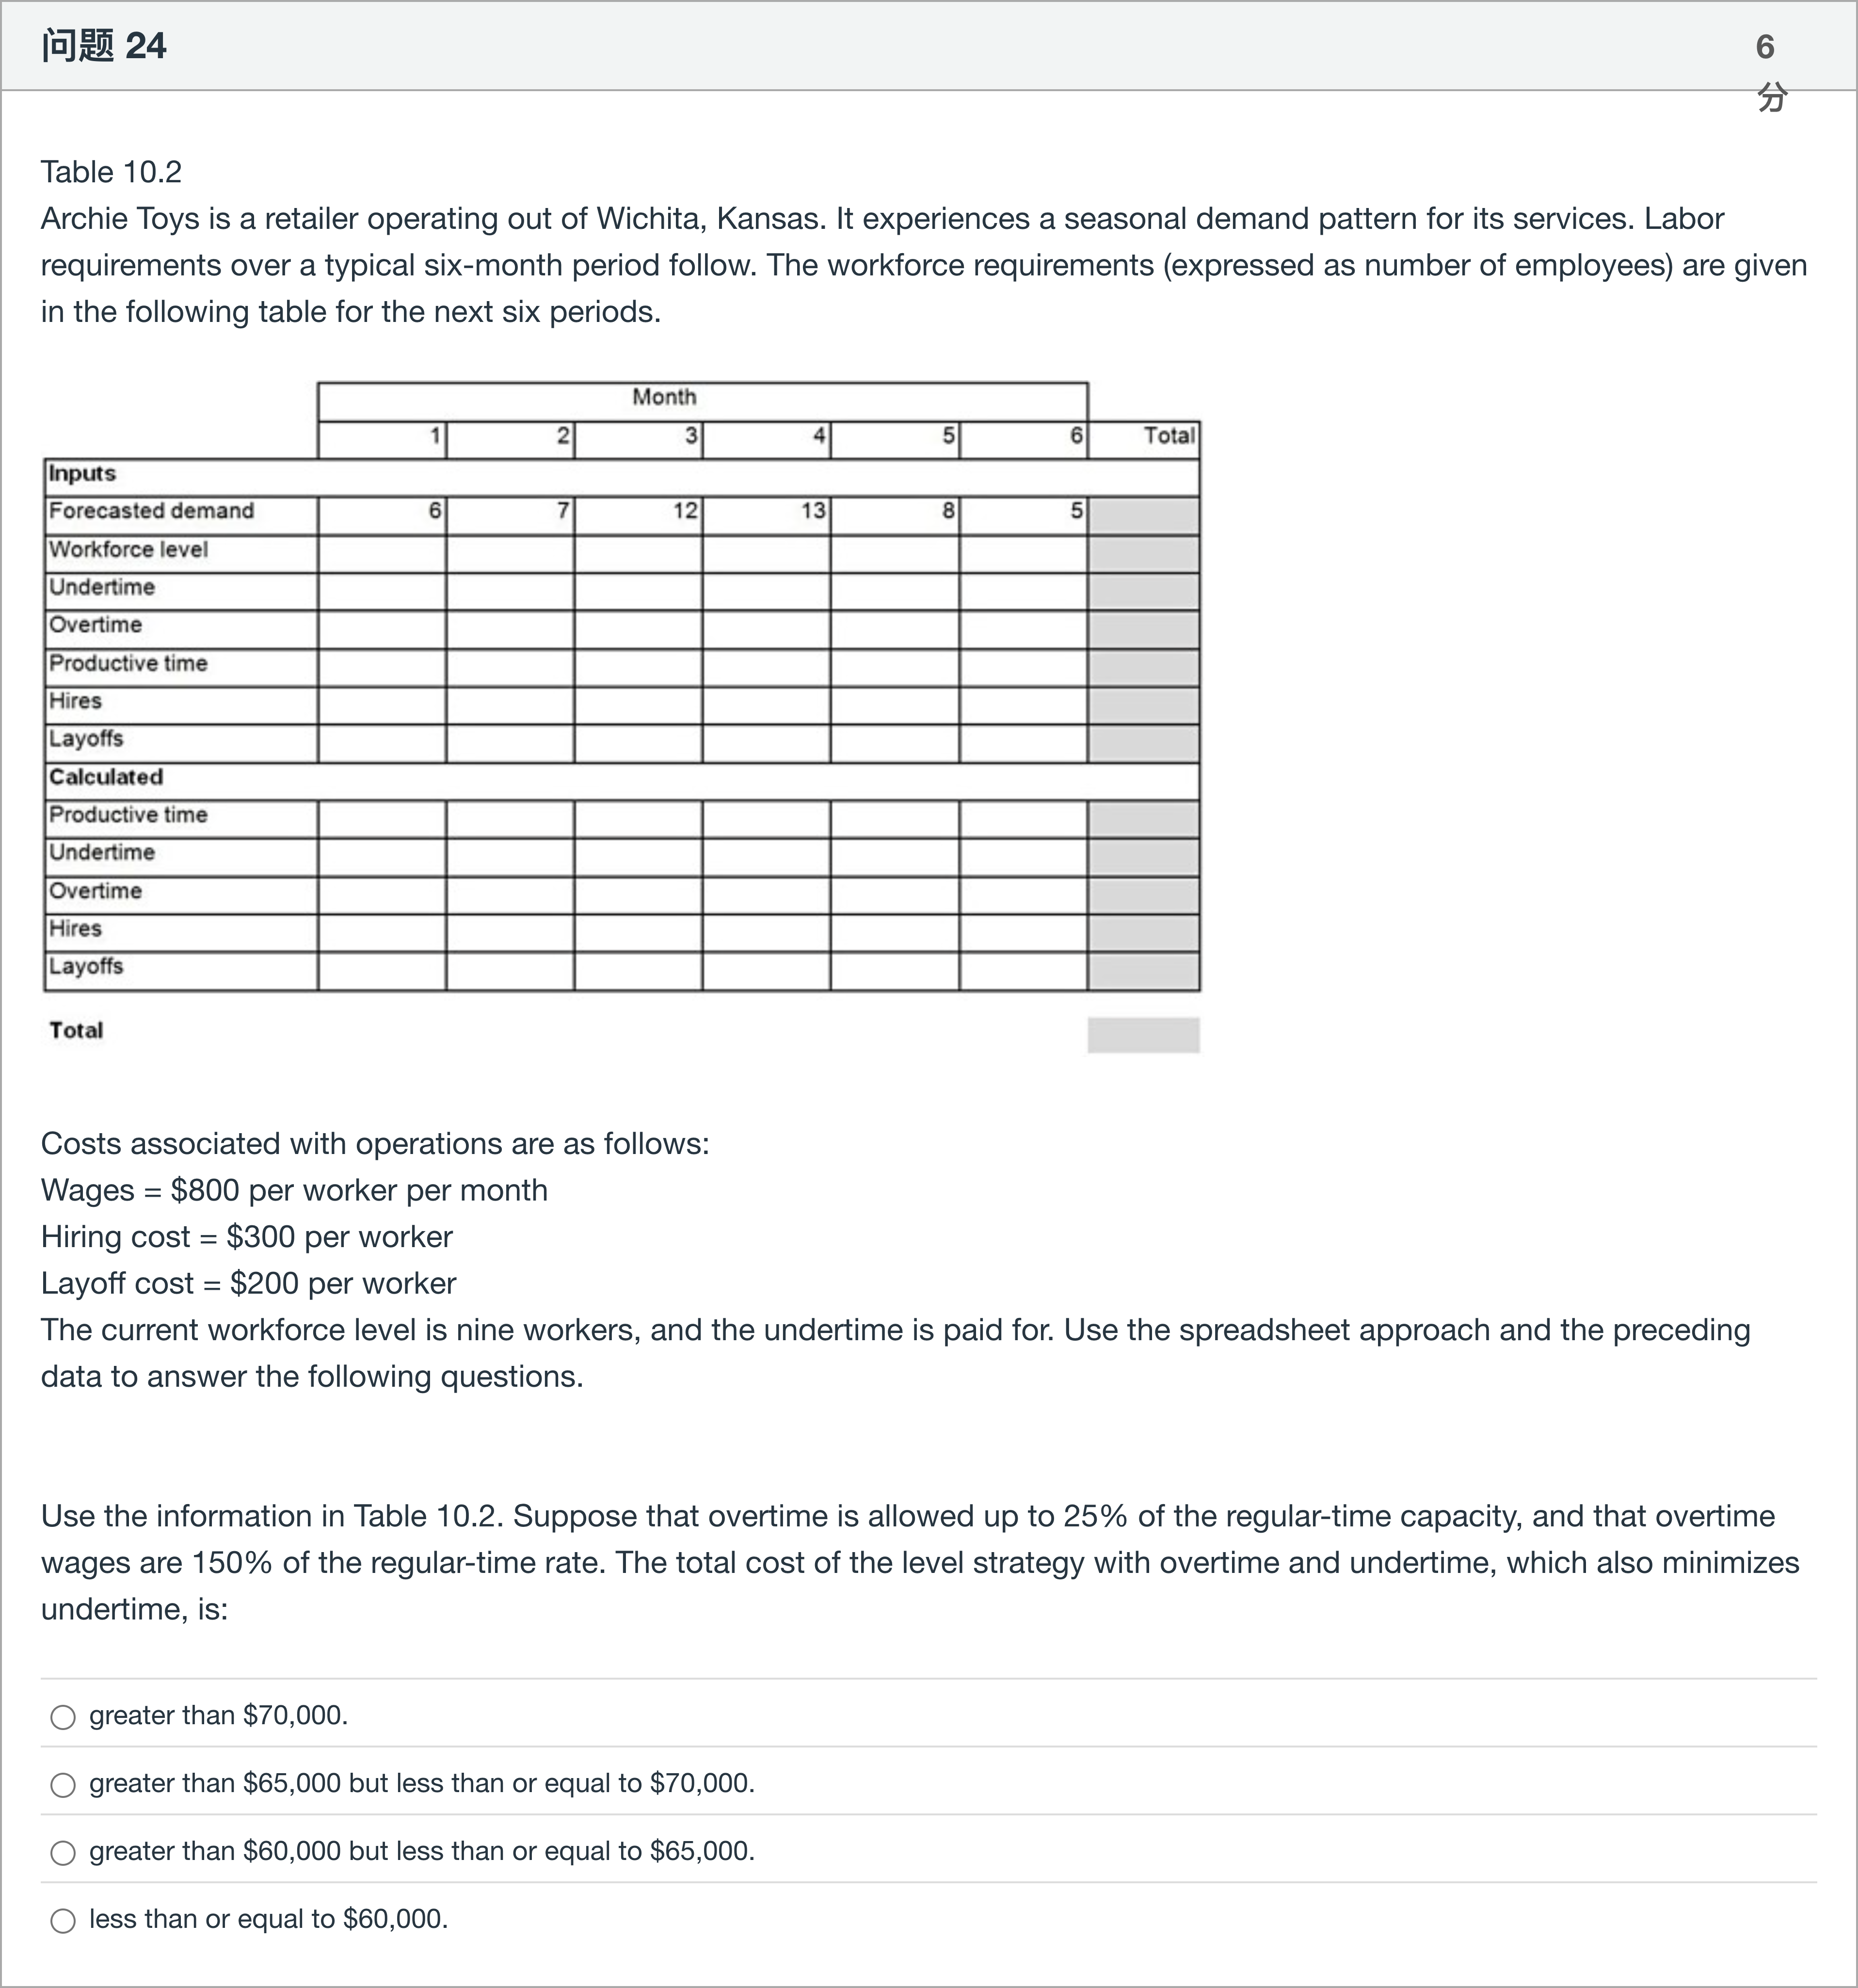
Table 10.2 Archie Toys is a retailer operating out of Wichita, Kansas. It experiences a seasonal demand pattern for its services. Labor requirements over a typical six-month period follow. The workforce requirements (expressed as number of employees) are given in the following table for the next six periods. Costs associated with operations are as follows: Wages = $800 per worker per month Hiring cost = $300 per worker Layoff cost = $200 per worker The current workforce level is nine workers, and the undertime is paid for. Use the spreadsheet approach and the preceding data to answer the following questions. Use the information in Table 10.2. Suppose that overtime is allowed up to 25% of the regular-time capacity, and that overtime wages are 150% of the regular-time rate. The total cost of the level strategy with overtime and undertime, which also minimizes undertime, is:
Options
A.greater than $70,000.
B.greater than $65,000 but less than or equal to $70,000.
C.greater than $60,000 but less than or equal to $65,000.
D.less than or equal to $60,000.
View Explanation
Verified Answer
Please login to view
Step-by-Step Analysis
First, I restate the scenario to ensure we’re analyzing the same data set. Archie Toys operates with six months of forecasted demand, and the table of inputs includes: current workforce level = 9 workers, wages = $800 per worker per month, hiring cost = $300 per worker, layoff cost = $200 per worker. Overtime is allowed up to 25% of regular-time capacity, with overtime wages at 150% of the regular rate. The question asks for the total cost of the level strategy with overtime and undertime that also minimizes undertime.
Option A: greater than $70,000.
- If the total cost were above $70k, it would mean that the combination of regular wages for a stable 9-person workforce, plus overtime costs (for months where overtime is used), plus undertime costs (for idle time when demand is below 9), and possibly any minimal undertime minimization strategy, sums to more than $70k over six months. Given six months of regular wages alone at 9 workers would be 9 × $800 × 6 = $43,200, any substantial use of overtime (even at 1–2 workers for some months) would push costs higher, and undertime costs add further......Login to view full explanationLog in for full answers
We've collected over 50,000 authentic exam questions and detailed explanations from around the globe. Log in now and get instant access to the answers!
Similar Questions
Question at position 3 In a Level Strategy, which of the following is/are true?inventory is accumulated during low demand months for use during high demand months.hiring and layoffs of workers is not allowed.the production level closely follows the demand pattern.a & b are true
A level strategy matches demand during the planning horizon by keeping the workforce level or the output rate constant.
Table 10.2 Archie Toys is a retailer operating out of Wichita, Kansas. It experiences a seasonal demand pattern for its services. Labor requirements over a typical six-month period follow. The workforce requirements (expressed as number of employees) are given in the following table for the next six periods. Costs associated with operations are as follows: Wages = $800 per worker per month Hiring cost = $300 per worker Layoff cost = $200 per worker The current workforce level is nine workers, and the undertime is paid for. Use the spreadsheet approach and the preceding data to answer the following questions. Use the information in Table 10.2. The total cost of the staffing plan, including the cost of regular wages, hiring, and layoffs using a chase strategy with hiring and layoffs but no overtime, is:
Table 10.1 A manufacturing firm uses a level utilization production-planning horizon of three months. They have developed a forecast for the coming three months that appears in the table. They can add no more than 5% of their production capacity as overtime and can order no more than 10% of a month's regular capacity via subcontractors. The company has a zero backorder policy but has space for a maximum of 250 items in their finished-goods inventory. All extra costs are shown in the table. October November December Forecasted Demand 2,100 1,900 2,350 Regular Capacity 2,000 2,000 2,000 Workforce level Overtime ($50/unit) Subcontracting ($120/unit) Inventory holding ($15/unit) Total Cost Use the information in Table 10.1. What is the ending inventory for the month of October corresponding to the least cost production plan?
More Practical Tools for Students Powered by AI Study Helper
Making Your Study Simpler
Join us and instantly unlock extensive past papers & exclusive solutions to get a head start on your studies!