Questions
Single choice
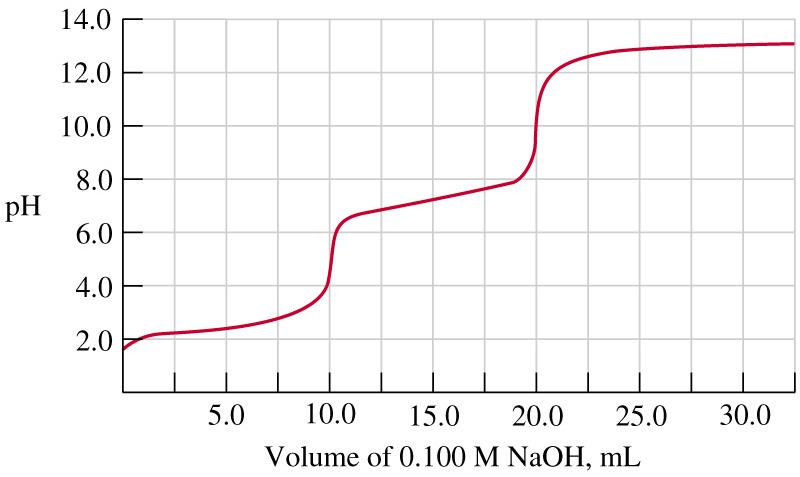
The given graph is a titration curve obtained for an acid base titration. How many protons are released from the acid used in this titration ? (Hint:asking whether monoprotic, diprotic...etc)
View Explanation
Verified Answer
Please login to view
Step-by-Step Analysis
To unpack what this titration curve is telling us, start by looking at the shape of the curve: a titration curve with two distinct vertical jumps in pH typically indicates two successive equivalence points, each corresponding to the neutralization of one proton from a polyprotic acid.
First, consider the initial region: the pH starts near acidic values (around 2–3), which is consistent with an acid in solution before any base is added. As ......Login to view full explanationLog in for full answers
We've collected over 50,000 authentic exam questions and detailed explanations from around the globe. Log in now and get instant access to the answers!
Similar Questions
Which of the following is true for weak acid + strong base titration?
The given graph is a titration curve obtained for an acid base titration. How many protons are released from the acid used in this titration ? (Hint:asking whether monoprotic, diprotic...etc)
Titrate 50.0 mL of 0.100 M acetic acid with 0.100 M NaOH. What is the pH after the following titrant additions: 40.0 mL?
A 50.00 mL sample of 0.0950 M acetic acid (Ka = 1.8 × 10⁻⁵) is being titrated with 0.0848 M NaOH. What is the pH after 28.00 mL of NaOH has been added?
More Practical Tools for Students Powered by AI Study Helper
Making Your Study Simpler
Join us and instantly unlock extensive past papers & exclusive solutions to get a head start on your studies!