Questions
Single choice
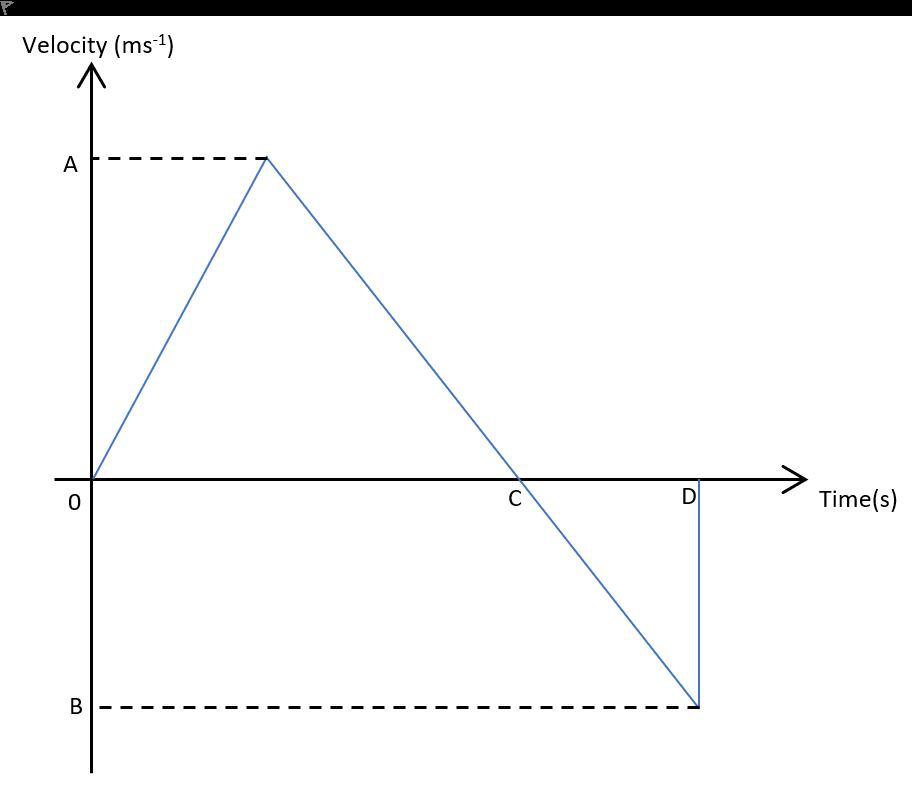
What is the physical quantity represented by the tangent drawn to this graph?
Options
A.a. Acceleration
B.b. Speed
C.c. Velocity
D.d. Displacement
View Explanation
Verified Answer
Please login to view
Step-by-Step Analysis
The graph shown has Velocity (ms^-1) on the vertical axis and Time (s) on the horizontal axis, so the curve represents how velocity changes with time.
Option a. Acceleration: The tangent to a velocity-time graph gives the rate of ......Login to view full explanationLog in for full answers
We've collected over 50,000 authentic exam questions and detailed explanations from around the globe. Log in now and get instant access to the answers!
Similar Questions
A student performs an experiment to determine the distance moved and velocity of a projectile as a function of time. A 1.00-kg object is initially at rest. The student applies a force of 19.6 N through a distance of 0.50 m to propel the object straight upward. It has an initial speed v and reaches a peak height h above the launch point. What is the average acceleration of the object from rest to v?
Referring to Figure 1.17 in Chapter 1 of the text (reproduced below), when the student is traveling between 300m-500m, which of the following statements are correct?
The graph shows the speed at which a remote controlled toy helicopter travels during a test flight along a straight flight path. What is the acceleration (in m s-2) of the helicopter during the first t1 = 9.8 seconds, if it reached a maximum speed of 8.3 m s-1?
The graph shows the speed at which a remote controlled toy helicopter travels during a test flight along a straight flight path. What is the acceleration (in m s-2) of the helicopter during the first t1 = 9.8 seconds, if it reached a maximum speed of 8.3 m s-1?
More Practical Tools for Students Powered by AI Study Helper
Making Your Study Simpler
Join us and instantly unlock extensive past papers & exclusive solutions to get a head start on your studies!